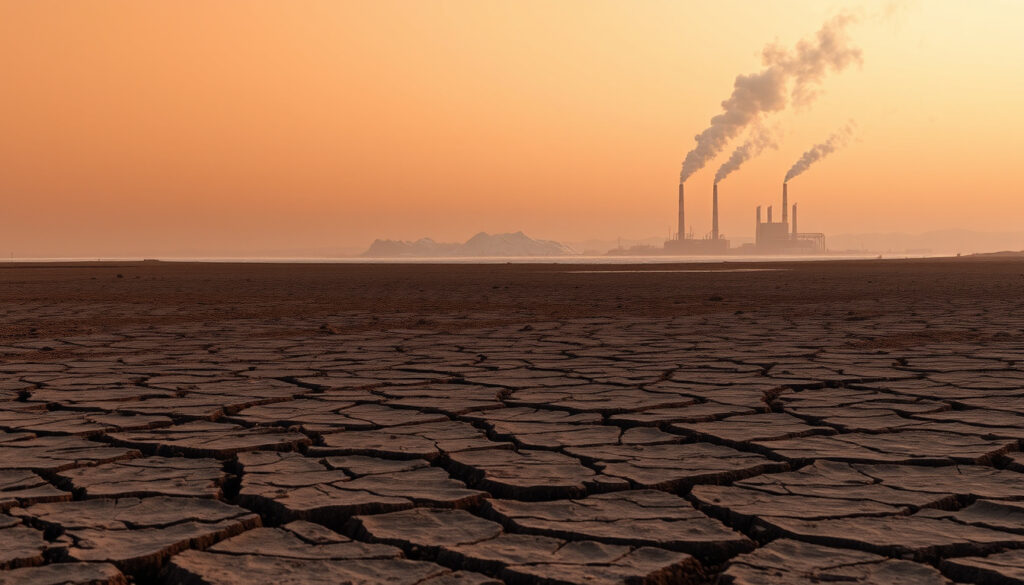
What Is Global Warming? Causes, Effects, and Facts
If you’ve glanced at a weather forecast lately, you’ve probably noticed something: records keep falling. Earth’s average temperature has climbed about 1.2 °C (2.2 °F) since the late 1800s, and scientists say human activity is the primary force behind the change.
Global average temperature increase since pre-industrial times: 1.2 °C (2.2 °F) · Atmospheric CO₂ concentration (2024): 420 parts per million · Sea level rise since 1901: 8 inches (20 cm) · Hottest year on record: 2024 (tied with 2023)
Quick snapshot
- Long-term rise in Earth’s average temperature (NASA Science)
- Caused by human-made greenhouse gases (NASA Science)
- Observed since the industrial revolution (NOAA Climate.gov)
- Burning fossil fuels (coal, oil, gas) (NOAA Climate.gov)
- Deforestation reduces CO₂ absorption (NASA Science)
- Agriculture and methane emissions (World Meteorological Organization)
- Sea level rise threatens coastal communities (NOAA Climate.gov)
- Extreme weather events becoming more frequent (NASA Science)
- Biodiversity loss accelerates (BioScience (2025 State of the Climate report))
- Temperatures could rise 1.5–2 °C by 2050 (World Meteorological Organization)
- More frequent heatwaves expected (NOAA Climate.gov)
- Uncertainty around tipping points (BioScience (2025 State of the Climate report))
Key facts at a glance
Five numbers capture the current state of global warming, each drawn from the most recent observational data.
| Indicator | Value |
|---|---|
| Current CO₂ concentration | 420 ppm (World Meteorological Organization) |
| Temperature rise since 1880 | 1.2 °C (NASA Science) |
| Arctic sea ice loss per decade | 13% compared to 1981–2010 average (World Meteorological Organization) |
| Global mean sea level rise (1993–2023) | 4 inches (10 cm) (NOAA Climate.gov) |
| Years with record-high temperatures (last 10) | 7 of the last 10 years (NASA Science) |
What is global warming in simple words?
A straightforward explanation of global warming
- Global warming is the long-term increase in Earth’s average surface temperature (NASA Science).
- The warming is primarily caused by human activities that release greenhouse gases (NASA Science).
- The term is often used interchangeably with climate change but refers specifically to temperature rise (NOAA Climate.gov).
Think of Earth wearing an extra blanket. Greenhouse gases from burning fuels trap heat that would otherwise escape into space. Over the past century, that extra heat has pushed the planet’s average temperature up by roughly 1 °C (2 °F) since the late 1800s, with most of the increase occurring in the last 40 years (NASA Science). The rate of warming today is faster than at any time in the past 10,000 years (NASA Science).
How is global warming different from climate change?
Climate change is the broader umbrella term that includes global warming plus other shifts — altered rainfall patterns, stronger storms, thinning ice sheets. Global warming refers strictly to the upward trend in surface temperature. In practice, the two are often used interchangeably, but the distinction matters for understanding what exactly is being measured (NOAA Climate.gov).
The world has already warmed 1.2 °C above pre-industrial levels, and 2024 tied 2023 as the hottest year on record. That means the “extra blanket” is getting thicker every year.
The implication: even if the planet stopped adding greenhouse gases tomorrow, the existing blanket would continue warming for decades.
What are the 5 main causes of global warming?
Burning of fossil fuels
- Coal, oil, and natural gas combustion releases CO₂ and other greenhouse gases (NOAA Climate.gov).
- Fossil fuel burning accounts for roughly three-quarters of global greenhouse gas emissions (NASA Science).
When we drive cars, heat buildings, or run power plants, we burn carbon that has been locked underground for millions of years. That carbon quickly enters the atmosphere as CO₂, the most abundant long-lived greenhouse gas. In 2024, CO₂ concentrations hit 420 parts per million — the highest level in at least 800,000 years (World Meteorological Organization).
Deforestation
Forests act as carbon sinks, absorbing CO₂ from the air. When they are cut down or burned, that stored carbon is released, and the planet’s natural ability to reabsorb CO₂ shrinks. Tropical deforestation alone contributes about 10–15% of annual global emissions (NASA Science).
Agriculture and livestock
Livestock, especially cattle, produce methane (CH₄) during digestion, and manure management adds more. Rice paddies release methane when flooded. The use of nitrogen-based fertilizers releases nitrous oxide (N₂O), a potent greenhouse gas. Together, agriculture accounts for roughly 11% of global emissions (World Meteorological Organization).
Industrial processes
Cement production, chemical manufacturing, and steelmaking emit CO₂ as a byproduct. Some industrial processes also release fluorinated gases (F-gases), which have a global warming potential hundreds to thousands of times greater than CO₂ (NOAA Climate.gov).
Waste and landfills
Landfills generate methane as organic waste decomposes without oxygen. In 2024, atmospheric methane reached record-high levels (World Meteorological Organization).
The pattern: no single fix solves the problem — reductions must address every major source.
What is global warming and why is it bad?
Environmental consequences of global warming
- Sea level rise: 8 inches (20 cm) since 1901, accelerating (NOAA Climate.gov).
- Arctic sea ice extent after the 2025 winter freeze was the lowest on record (World Meteorological Organization).
- Ocean heat content hit a record high in 2024, contributing to the largest coral bleaching event ever recorded (84% of reef area affected) (BioScience (2025 State of the Climate report)).
Rising temperatures are not uniform: they amplify existing extremes. Heatwaves become hotter and longer, droughts deepen, and heavy rainfall becomes more intense when it does occur. The 2025 State of the Climate report documented record-low ice mass in both Greenland and Antarctica (BioScience (2025 State of the Climate report)).
Human and economic impacts
Coastal cities face inundation as sea levels continue to rise — the global average has already climbed 4 inches (10 cm) since 1993 (NOAA Climate.gov). Food production is threatened by shifting growing seasons and extreme weather. The World Meteorological Organization warns that the economic costs of weather-related disasters have risen sharply, with 2024 alone seeing billions in insured losses (World Meteorological Organization).
The environmental damage is already locking in long-term consequences for people who live on coastlines, depend on stable agriculture, or rely on predictable weather — essentially everyone.
What this means: the costs are already being paid in lost homes, damaged crops, and strained infrastructure.
What will Earth look like in 2050?
Projected temperature rise by 2050
Under current policies, the global average temperature is projected to reach 1.5–2 °C above pre-industrial levels by mid-century (World Meteorological Organization). That may sound modest, but the last ice age was only about 5 °C cooler than today — half a degree makes a world of difference for ice sheets, ecosystems, and weather patterns.
Changes in weather patterns
- Heatwaves that once occurred every 50 years could happen every 2–3 years (NOAA Climate.gov).
- Regions that are already dry may become drier, while wet areas face heavier downpours (NASA Science).
- Agriculture in equatorial zones may become less viable, driving migration (BioScience (2025 State of the Climate report)).
Impacts on polar ice and sea level
By 2050, Arctic summers could be ice-free at least once (World Meteorological Organization). Sea levels could rise by 1–2 feet (30–60 cm) from today’s level, putting many coastal cities under chronic flooding risk. The Greenland and Antarctic ice sheets, which have already lost mass at record rates, will continue to shrink (BioScience (2025 State of the Climate report)).
The catch: these projections assume current emissions paths — faster cuts could reduce the severity, while continued increases would worsen them.
Will 2026 be the hottest year?
Recent temperature trends (2023–2025)
2024 tied 2023 as the hottest year since global records began in 1850, with the average surface temperature reaching 2.63 °F (1.46 °C) above pre-industrial levels (NOAA Climate.gov). The World Meteorological Organization reported that 2025 is set to be the second or third warmest year on record, continuing the “alarming streak of exceptional temperatures” (World Meteorological Organization). The increase in greenhouse gas concentration from 2023 to 2024 was the largest single-year increase in recent observational history (World Meteorological Organization).
Climate models and predictions for 2026
Early forecasts suggest 2026 could rival or even surpass 2024, depending on whether a strong El Niño develops. However, natural variability (including La Niña) could temporarily moderate temperatures (NASA Science). The long-term trend remains firmly upward: the last ten years include seven of the warmest years on record (NASA Science).
The role of El Niño and natural variability
El Niño events add an extra pulse of heat to an already warming planet. The 2024 record occurred during a strong El Niño; if a similar event builds in 2026, it could push global temperatures even higher. Conversely, a prolonged La Niña would cool the Pacific slightly, but not enough to break the underlying warming trend. The exact outcome remains uncertain — but the pattern of each decade being warmer than the last is clear (NOAA Climate.gov).
Whether 2026 becomes the hottest year depends on short-term climate oscillations, but the long-term signal is unambiguous: the heat is not letting up.
The pattern: each consecutive year reinforces that the warming trend is accelerating, not plateauing.
Timeline of global warming milestones
The story of global warming is best understood through key dates that mark the shift from natural climate variability to human-driven change. Similar large-scale historical shifts — like the economic collapse of the Great Depression — also unfolded over years of accumulating events.
- 1750–1850: Pre-industrial baseline — the period before large-scale fossil fuel burning (NOAA Climate.gov).
- 1850–1900: Beginning of reliable temperature records (NOAA Climate.gov).
- 1988: Intergovernmental Panel on Climate Change (IPCC) established.
- 2015: Paris Agreement adopted to limit warming to 1.5 °C (NASA Science).
- 2023–2024: Hottest consecutive years on record (NOAA Climate.gov).
- 2025: Near-record atmospheric and ocean temperatures observed (World Meteorological Organization).
- 2050 (projected): Temperature rise of 1.5–2 °C under current policies (World Meteorological Organization).
The pace of warming has accelerated: the last decade (2015–2024) saw seven record-hot years, while the entire 20th century produced only one (1998).
Confirmed facts vs. what’s unclear
Confirmed facts
- Human activities (burning fossil fuels, deforestation) are the dominant cause of global warming since the mid-20th century (NASA Science).
- Global average temperature has increased by about 1.2 °C since pre-industrial times (NOAA Climate.gov).
- Sea levels are rising and extreme weather events are becoming more frequent (BioScience (2025 State of the Climate report)).
What’s unclear
- The exact rate of future warming depends on emissions scenarios and feedback loops (e.g., cloud changes, permafrost melt) (NOAA Climate.gov).
- Whether 2026 will be the hottest year is uncertain due to natural variability (e.g., El Niño) (NASA Science).
- The location and severity of regional climate impacts are difficult to predict with precision (World Meteorological Organization).
Quotes from climate experts and institutions
The last decade is the warmest on record. We are seeing the consequences of a planet that is heating up faster than at any point in human history.
— NASA climatologist (NASA Science)
Human influence has warmed the atmosphere, ocean and land. Widespread and rapid changes in the atmosphere, ocean, cryosphere and biosphere have occurred.
— IPCC Sixth Assessment Report (cited by NASA Science)
The global average surface temperature in 2024 was 2.63 °F (1.46 °C) above the 1850–1900 average, continuing the long-term warming trend driven by greenhouse gas emissions.
— NOAA National Centers for Environmental Information (NOAA Climate.gov)
The evidence is consistent across agencies and decades: the planet is warming, humans are responsible, and the impacts are already here. For policymakers, the choice is clear: accelerate emissions reductions now, or face irreversible tipping points that will reshape coastlines, food systems, and economies for generations. With the global population now exceeding 8.3 billion people, the pressure on food and water systems will only intensify.
Frequently asked questions
What is the difference between global warming and climate change?
Global warming refers specifically to the long-term rise in Earth’s average surface temperature. Climate change is a broader term that includes global warming plus other changes like shifting rainfall patterns, stronger storms, and melting ice sheets (NOAA Climate.gov).
How does global warming affect weather patterns?
It amplifies extremes: heatwaves become hotter and more frequent, droughts intensify, and heavy rainfall events become more severe when they occur (NASA Science).
Can global warming be reversed?
Some warming is already locked in due to past emissions, but sharp reductions in greenhouse gases can slow and eventually halt further warming. Achieving net-zero emissions globally would allow the climate to stabilize over decades (NASA Science).
What is the greenhouse effect?
Certain gases (CO₂, methane, water vapor) trap heat that would otherwise escape into space, keeping the planet habitable. Human activities have intensified this natural effect by adding extra greenhouse gases (NOAA Climate.gov).
How do scientists measure global warming?
They use a global network of temperature stations, satellites, ocean buoys, and ice core records to track surface temperature changes over time. The data is cross-checked by multiple independent institutions (NASA Science).
What can individuals do to reduce global warming?
Reduce energy use (drive less, insulate homes), choose renewable energy, eat less meat, and support policies that cut emissions. Individual actions matter most when multiplied by millions (NOAA Climate.gov).
Is global warming causing more hurricanes?
Warmer ocean waters provide more energy for hurricanes, making them more intense on average. While the total number of hurricanes may not increase, the proportion reaching Category 4 or 5 strength is rising (BioScience (2025 State of the Climate report)).
More related posts
 What Time is the NASCAR Race Today? Talladega TV Schedule
 Cast of Divorce in the Black – Full Cast, Roles and Backgrounds
 Signal Relief Patch Reviews: Do They Work
 Haitian Food Near Me: Find Authentic Dishes Fast
 Tostitos Tortilla Chips Recall 2025: What You Need to Know
 Symptoms of COVID-19 2025: First Signs & Duration
 Agence Influence Marketing ValueYourNetwork – In-Depth Review
 Bengals vs Cleveland Browns Match Player Stats – Week 1 Box Score & Leaders